It is ironic that we humans pollute the very air that we breathe in but our activities for progress and development that we desire and work for everyday has made air pollution an inevitable hazard. In a country like India, where both population and economic development increased rapidly in past seven decades, air pollution has reached a stage where many cities in India are among the most polluted cities in the world. In a recent World Air Quality 2018 report released by IQAir Group and Greenpeace (AirVisual, 2019), it was reported that fifteen of the top 20 most polluted cities in the world are located in India.
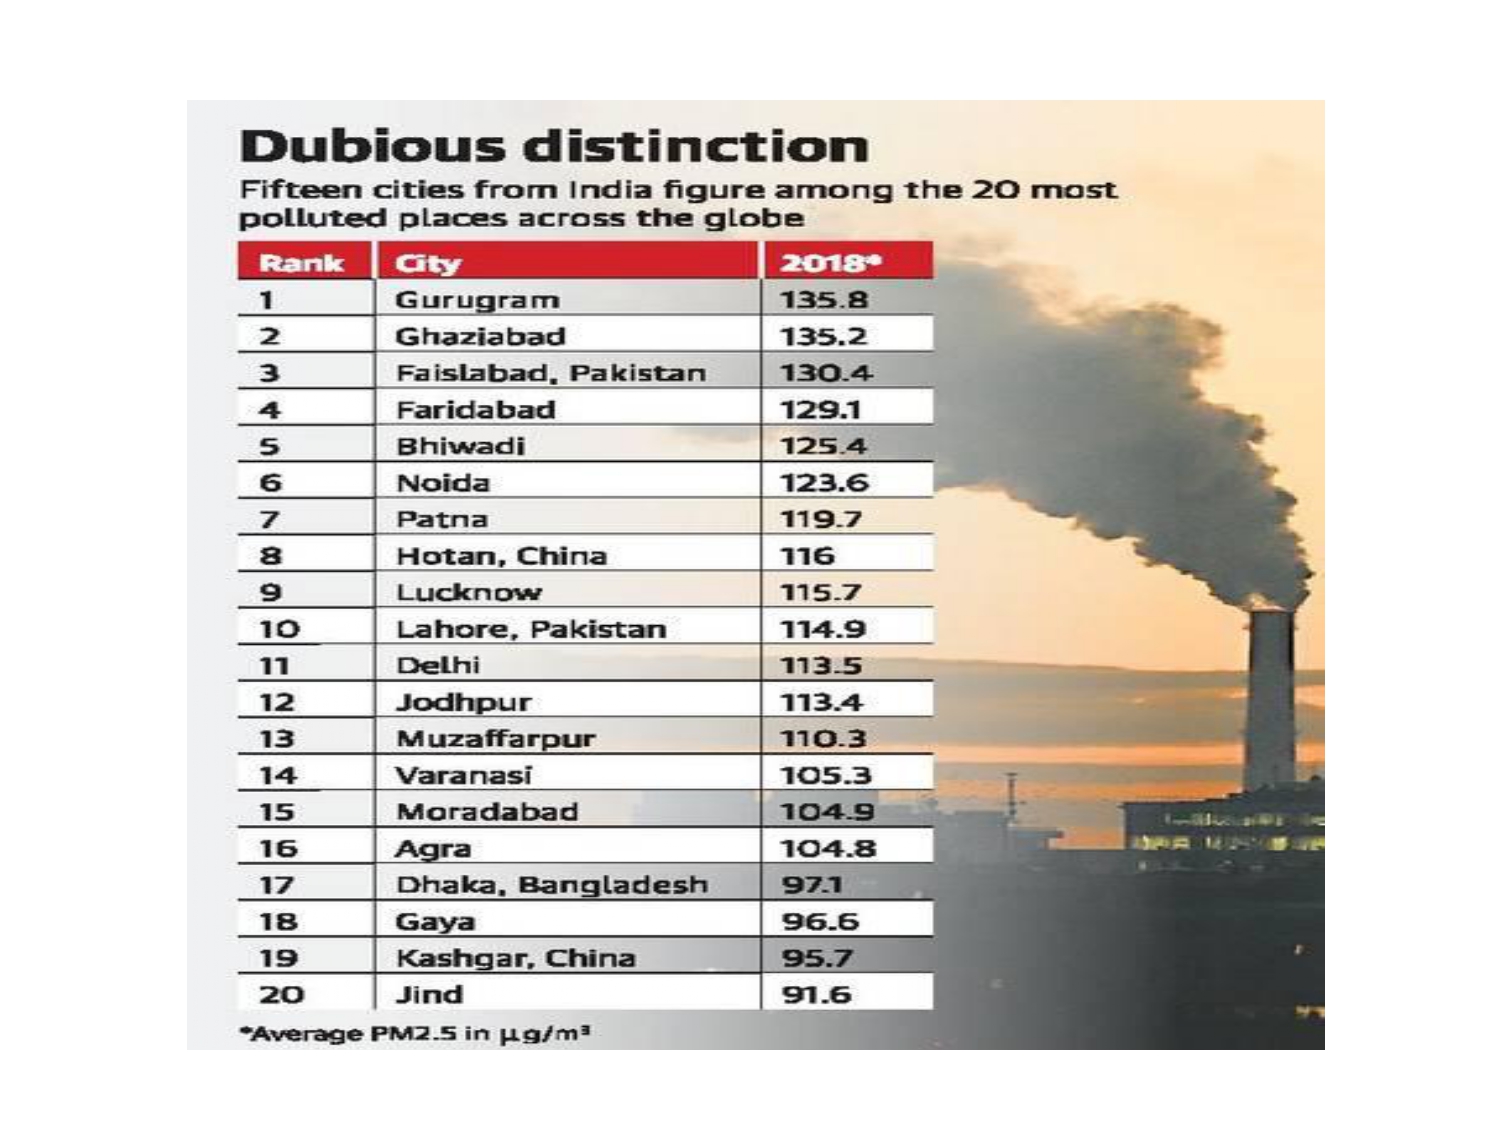
Figure 1: Top 20 polluted cities in the world
Source: The Hindu, March 05, 2019 (Koshy, 2019)
By definition, air pollution is contamination of ambient air by chemical species in such concentrations and for such duration that is harmful to general health. Central Pollution Control Board (CPCB) has established National Ambient Air Quality Standards (NAAQS) for some of the most common air pollutants which are mainly particulate matter (PM), carbon monoxide (CO), ground-level ozone, nitrogen dioxide (NOx), sulfur dioxide (SO2) and lead. These are known as “criteria” air pollutants (EPA, 2015). Further, the air pollutants can be primary or secondary depending upon their formation mechanism (CPCB, 2006). Primary pollutants such as CO, NOx and SO2 are directly emitted from the source while secondary pollutants such as ozone and some aerosols are formed in the atmosphere.
Sources of Air pollution Emissions in India
A diverse range of pollution sources co-exists in urban environments. Conventional sources of air pollution include vehicular emissions, coal-based power plants, fossil fuel consumption in industries and some agricultural activities such as fertilizer application and farm fires. Air pollutants can be natural or may be the result of various anthropogenic activities. Examples include production of brick kilns that use raw wood, agricultural waste or poor quality coal used as a fuel, the roadside burning of organic and plastic waste, cooking that involves the burning of solid biomass or cow dung and the unintentional burning of municipal solid waste at landfills, and construction activities (Kumar et al, 2015) (Figure 3). The local emission inventories point to about 5300 and 7550 tons yr−1 of PM10 and PM2.5 release from waste burning in Delhi, respectively, while the corresponding emissions from construction are 3250 and 10,750 tons yr−1 (Guttikunda and Goel, 2013). Other such sources include diesel generators for temporary power generation in cities, traffic congestion, and unregulated small industries.
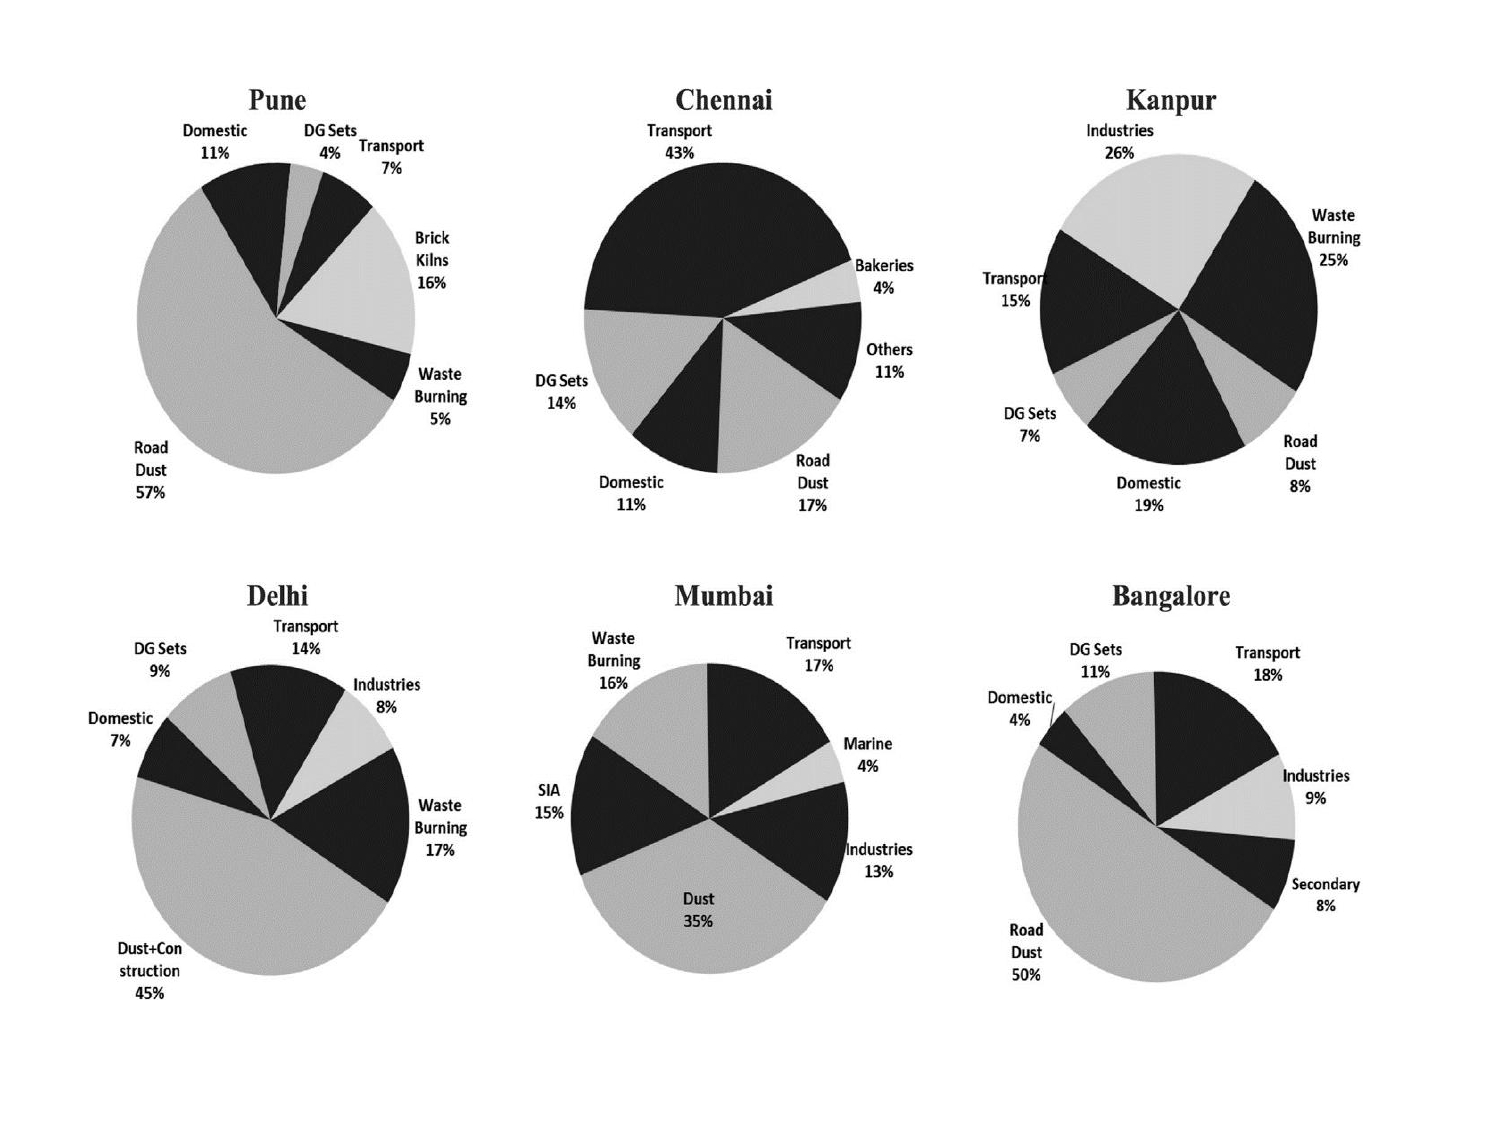
Figure 2: Average percent contributions of major sources to PM10 pollution as per CPCB inventory (Source: Guttikunda et al, 2014)
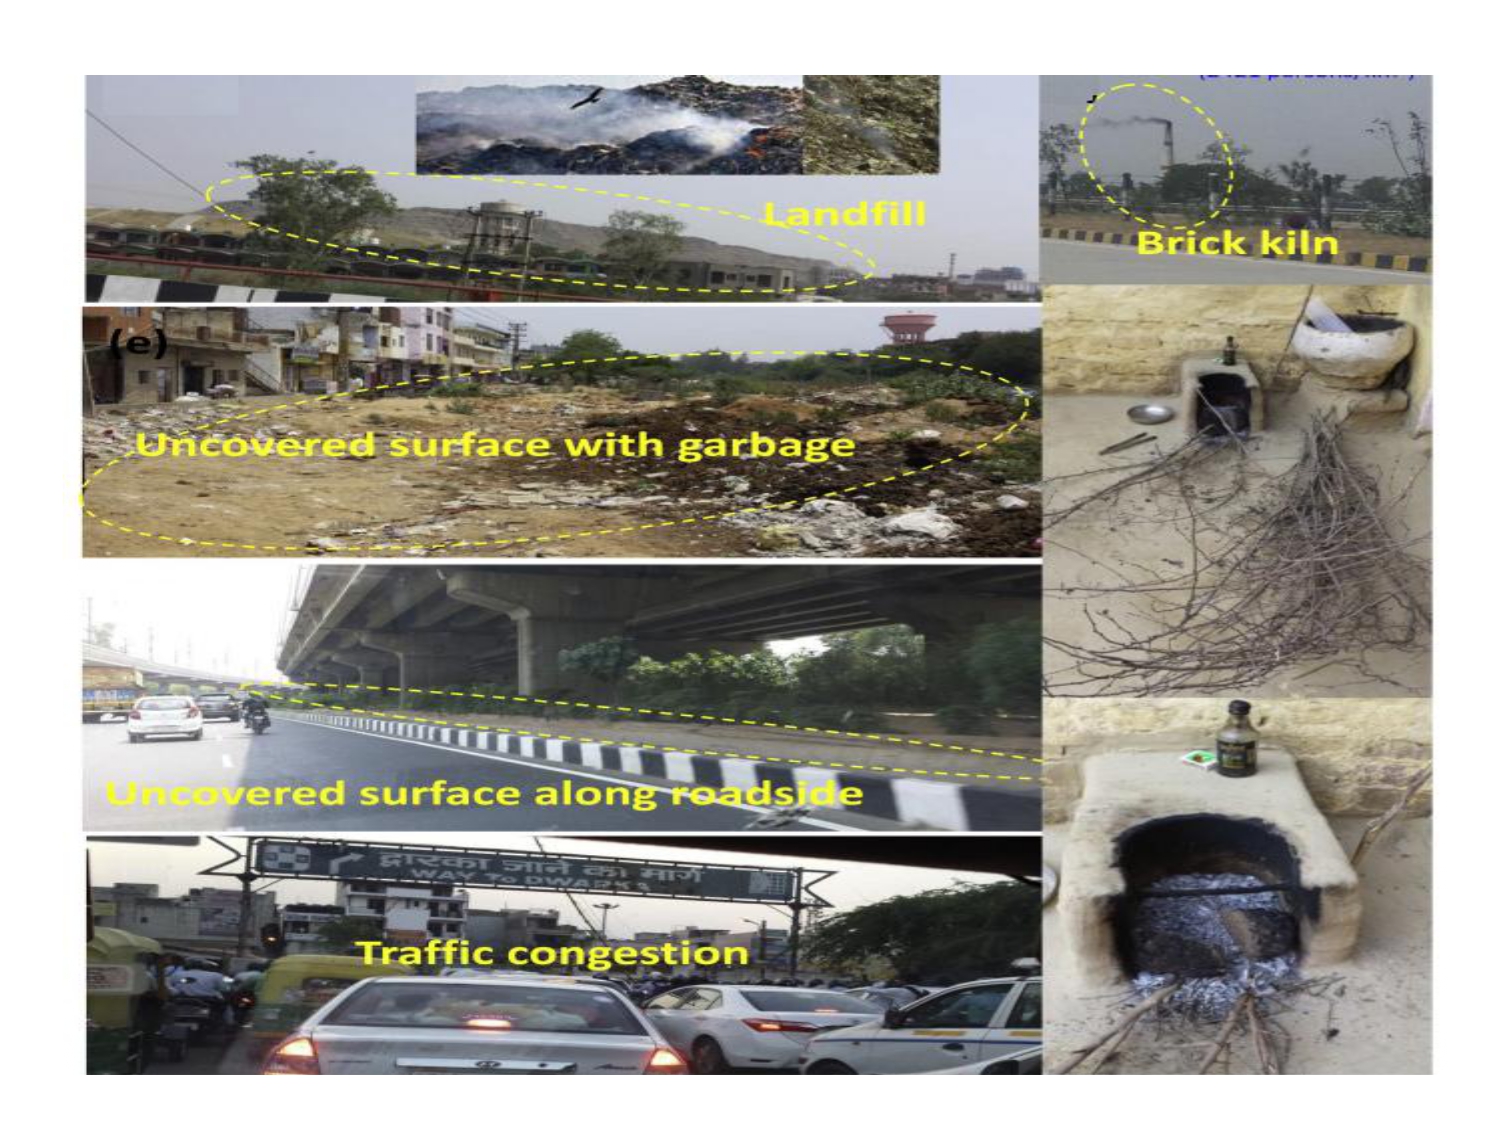
Figure3: There are many unregulated and unaccounted sources of pollution such as landfill, brick kilns, loose soil and waste dumping, biomass burning for cooking using chulhas, dry uncovered surface along the roadside, and traffic congestion (Source: Kumar et al, 2015)
Particulate Matter: A National Threat
According to CPCB annual report 2015-16, out of the 46 million-plus population cities in India, 8 cities (18%) and 38 cities (86%) exceed the NAAQS with respect to NO2and PM10 respectively in the residential/industrial/rural/commercial areas. Hence, in India, fine particulate matter (PM10, PM2.5) have emerged as pollutants of major concern.
In a recent survey study (Bernanrd & Kazmin, 2018), The Financial Times collated NASA satellite data of fine particulate matter (PM2.5) and mapped it against population density data from the European Commission to develop a global overview of the number of people affected by this type of dangerous pollution. It was revealed in their study that although historically China has grabbed most headlines for poor air quality, between 1998 and 2016, India has acquired far worse state of pollution than its larger neighbour ever was. At least 140 million people in India are breathing air 10 times or more over the WHO safe limit. WHO prescribes a standard of 10 μgm-3however, more than 60% of India’s districts have annual concentrations of more than 40 μgm-3(Figure 4).
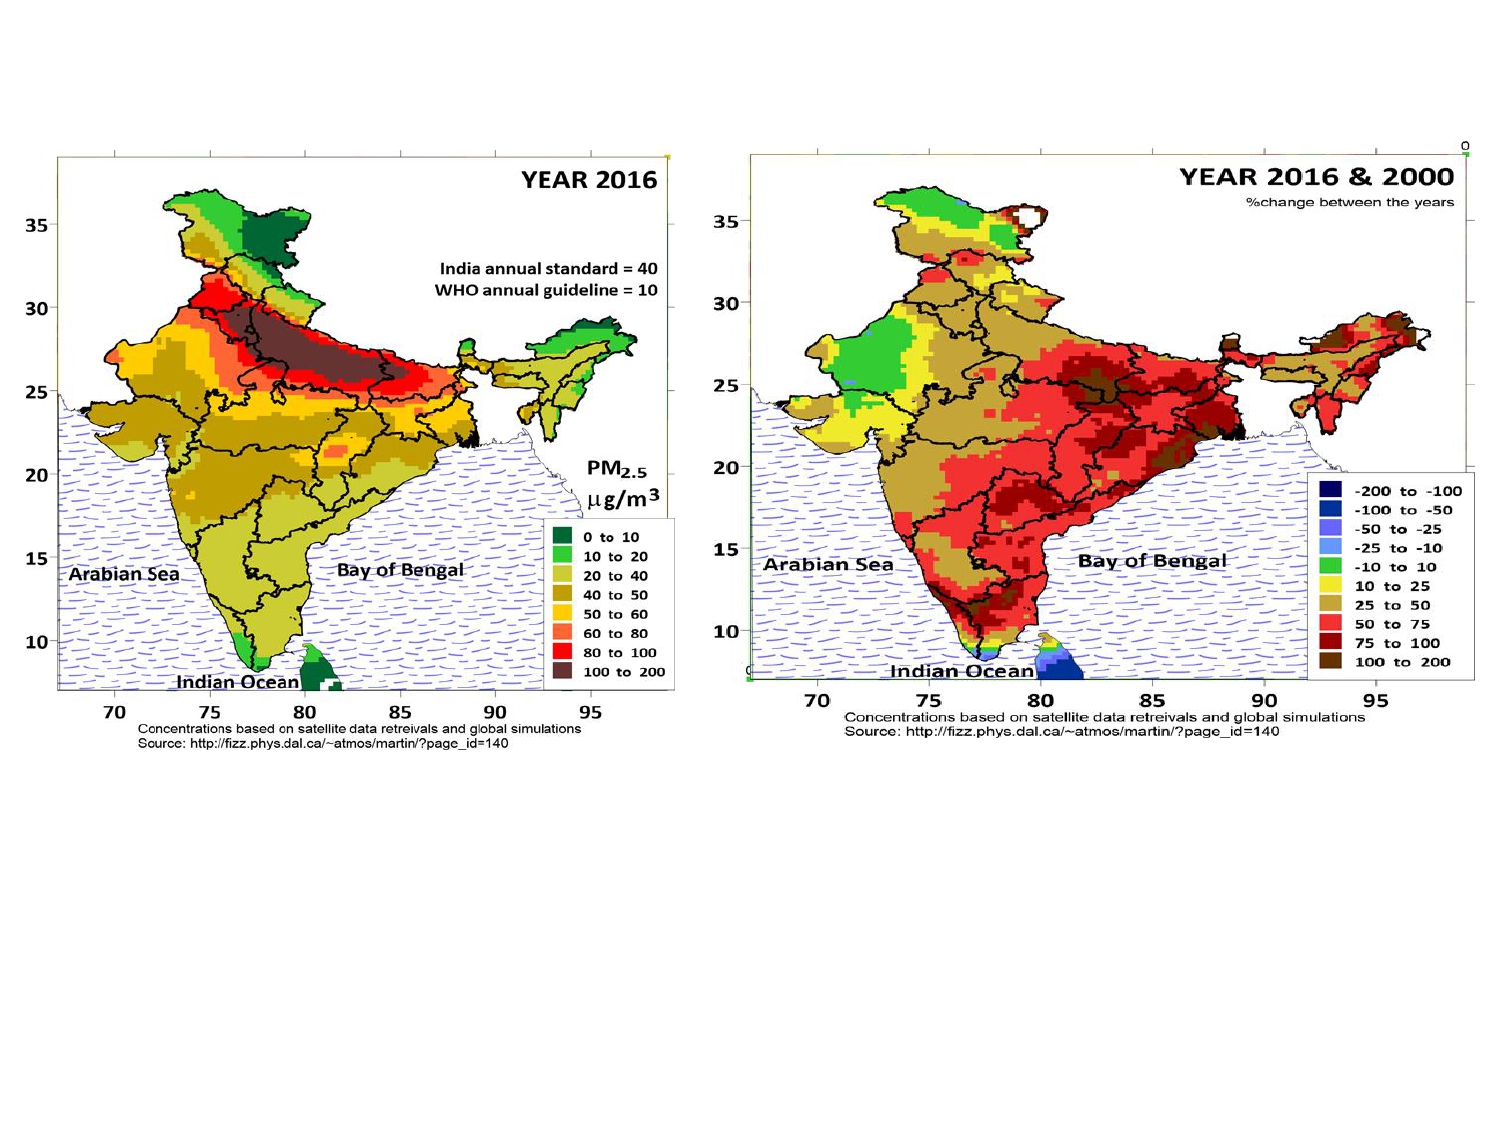
Figure 4: PM2.5 levels have increased in major parts of the country
Source: Urbanemissions.info (Guttikunda, 2018)
Health Effects of Air Pollution
Strong links have long been established between exposure to air pollution and cardiovascular diseases, such as strokes and heart disease; cancers; chronic obstructive pulmonary diseases; respiratory diseases, including acute respiratory infections (especially in vulnerable groups like children and elderly); poor birth outcomes, etc. These entail adverse health, economic and developmental consequences (WHO, 2018).
In a study that appeared in The Lancet (Cohen et al, 2017), India had a contribution of 50 % in global estimates of mortality and disability-adjusted life-years attributable to ambient particulate matter pollution for the year 2015. 1 in 8 deaths in India is attributable to air pollution. A study by researchers of the Energy Policy Institute at the University of Chicago (EPIC) concluded that people in India would live 4.3 years longer if the country met the WHO guidelines (EPIC, 2018).
Impacts of development on meteorology and air pollution
Urbanisation: Massive growth in urbanisation has been found to coincide with the growth in air pollution in many studies. Other than increase in pollution-emitting sources such as vehicles and industries, urbanisation also influences meteorology which in turn affects air quality as urban areas are often associated with altered meteorologies such as higher temperatures and lower wind speeds.
For instance, there is a considerable growth of urban and built-up area during the recent decades over National Capital Region (NCR) of India (17-fold increase in the urban extent). Results indicate a warming of 1.5–2 °C in the surface temperature and 4–5 °C in land surface temperature (LST) during the evening and nighttime due to the changes of land use land cover (LULC) to urban areas during the past five decades
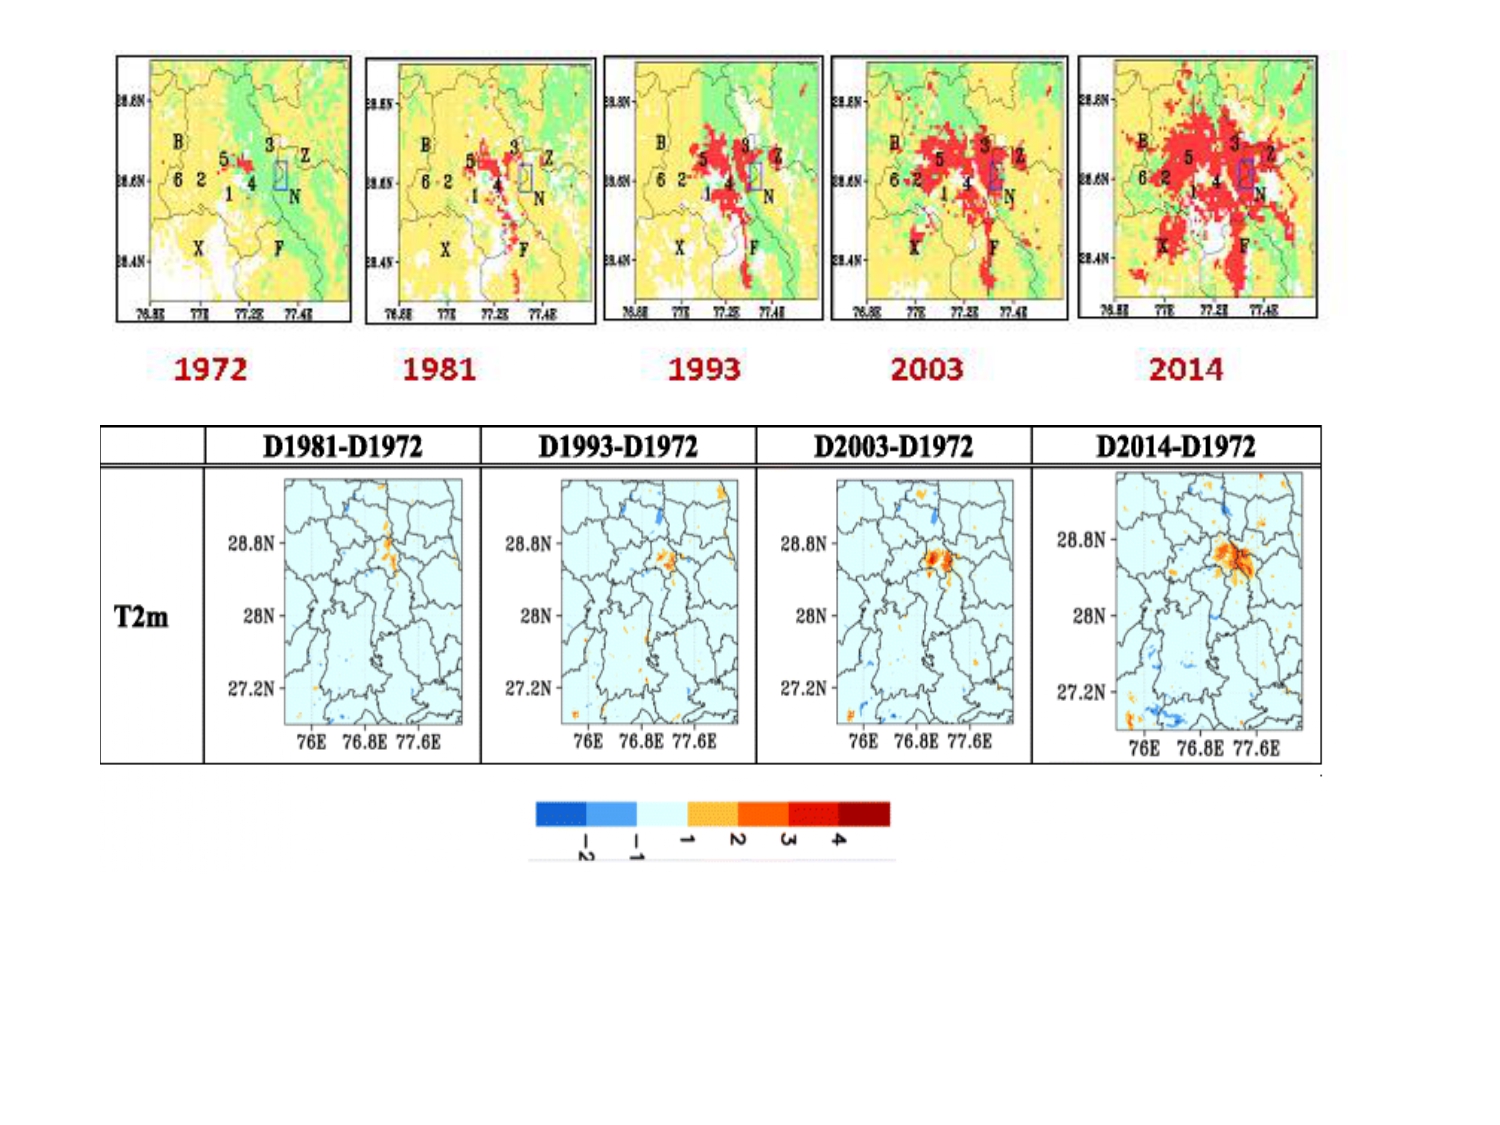
Figure 5 : (Top Panel) Urban expansion as indicated by red colour for Delhi and its satellite. The colour yellow and green are for mixed croplands and irrigated croplands, respectively. (Bottom Panel) Ambient temp increase with the increase in urbanisation over Delhi-NCR every decade Source: Sati and Mohan, 2018
In a city, areas with high urban density are often marked with higher temperatures in comparison to the surrounding areas, a phenomenon known as urban heat island. Urban heat island effect has now been studied in many Indian cities including Delhi where temperatures at highly dense areas were observed to be higher by about 8-10°C in comparison to green areas within the city (Mohan et al 2012, 2013).
Technologies for Air Pollution Monitoring
- The central nodal monitoring agency, CPCB, has two types of monitoring network. Under manual monitoring network, the air is sampled and then sent to lab for analysis. Under continuous ambient air quality monitoring (CAAQM) real-time data is generated by the instruments which are also displayed online for the public in general. As of 2018, there are 134 locations in the country with manual stations (CPCB, 2018) while 157 locations with CAAQ monitoring (CPCB, 2019). Some of the conventional instruments for air pollution monitoring are Fourier transform infrared (FTIR) instruments, gas chromatographs, and mass spectrometers (Prasad et al, 2011).
- Nowadays, there are several categories of low cost sensors available for air pollution mitigation (European Commission, 2016). Electrochemical sensors are based on a chemical reaction between gases in the air and the electrode in a liquid inside a sensor. They are used to measure NO2, SO2, O3, NO and CO.
- Pollutants like NO2, O3, CO are also measured by metal oxide sensor (resistive sensor, semiconductor) in which gases in the air react on the sensor surface and modify its resistance.
- VOCs are measured by photo ionization detectors which ionise volatile organic compounds and measures the resulting electrical current.
- Optical particle counters detect particulate pollution by measuring the light scattered by particles. Optical sensors detect gases like carbon monoxide and carbon dioxide by measuring the absorption of infrared light.
Numerical Modeling for Air Quality Management
Air quality modeling is not only useful for forecasting but also for air quality management. However, for that, prior evaluation is necessary to have confidence in the application of the model. Model performance should be analysed for different simulation design combinations (Mohan and Sati, 2016), sensitivity to different physical parametrisation (Mohan and Bhati, 2011; Gunwani and Mohan, 2017) and different chemical mechanisms for simulation of air pollutants like particulate matter and ozone (Mohan and Gupta 2018, Gupta and Mohan, 2015).
Having an established modeling framework helps in the assessing source contribution of different air pollutants. It also helps in investigating contribution of long-range transport of pollution.
Recent studies based on model simulations show the influence of geographical domain on PM10concentrations in Delhi and revealed that the contributions from long range transport towards National Capital Territory of Delhi can be as high as 26% to 97% during summer and 13% to 68% during winter conditions especially during high pollution episodes. It was inferred that the high levels of PM10 concentration is not only due to local pollution but is also highly influenced by remote sources (Gupta and Mohan, 2013). Air pollution forecast models also provide a framework for the evaluation of different mitigation options for pollution abatement.
Initiatives by the Government of India
In India, the government is looking at innovative solutions for tackling air pollution (WHO, 2016)
- The Swachh Bharat Abhiyan encourages citizens to adopt cleanliness in all spheres of life and is particularly relevant and timely.
- The ‘Smart Cities’ initiative assures urban planning, building energy efficient housing and a good network of public transport, all of which are environment-friendly. Citizens’ participation is in-built, thus ensuring sustainability.
- Promoting more equitable access to clean fuels by removing blanket subsidy on cooking gas to high-income group and including more households from a low-income group in the LPG distribution list are appreciable steps to address household air pollution.
- The government has also constituted a multisectoral Steering Committee to address air pollution, both household and ambient; WHO India is a member of this forum.
- Smoke-free legislation to reduce exposure to second-hand smoke is already in place in India viz. Cigarette and other Tobacco Products Act, 2003. India is also a signatory to the WHO Framework Convention on Tobacco Control, 2004.
- Technologies and strategies in Practice (Gurjar et al, 2016)
Industrial emissions are regulated under the Environment Protection Act, 1986 which involves installation of pollution control equipment to meet the emission guidelines. CPCB has identified 24 critically polluted areas and action plans have been formulated to improve the air quality of these areas. For coal power plants located more than 1000 km from the pit head, ash content of the coal used has to be below 34%.
Environmental clearance from Ministry of Environment and Forest (MoEF) has been made mandatory for establishment of development projects (29 categories) which involves conducting Environmental Impact Assessment (EIA) study, public hearing and submitting the environmental statement.
Moreover, other mitigation measures such as reduction in the sulfur contents of the coal, relocation of industries (i.e. displacement of industries from inner parts of city to outer areas), use of clean fuel [e.g. use of less ash and sulfur content coal, liquid petroleum gas (LPG)] and application of air pollution control devices have been taken into account.
For reducing dust emissions from stone crushers, use of enclosed structures and water spraying system have been adopted. The industrial segment mostly employs electrostatic precipitator filter type air purifiers, which removes fine particles such as dust and smoke,
from a flowing gas using the force of an induced electrostatic charge, thereby minimally impeding the flow of gases through the unit.
Other technologies in practice are flue gas desulphurisation, bag filters, wet collectors, multi-cyclones, carbon sequestration, industrial fans, gas conditioning systems, catalytic reduction, and fabric filters.
Various measures have been taken by government to reduce vehicular emissions such as introduction of cleaner fuels (e.g. unleaded gasoline, ultra-low sulfur diesel, CNG, LPG), improved engine technologies, introduction of Bharat Norms (equivalent to Euro norms), alternate public transport (Delhi metro rail) to trim down the growing energy demand and emissions. A series of stricter norms for vehicular emission reduction (Bharat Stage I-IV) has been adopted by the Ministry of Road Transport and Highways since 2000.Leaded gasoline was phased out from the entire country from the early 1990s till 2000, and Benzene concentration in gasoline was regulated to 3% in all India. Moreover, moving towards hybrid and electric transport vehicles in a planned manner is a major step.
Challenges towards air pollution management
Poor information exchange on best practice in urban air quality management and the lack of harmonized air pollution policies in the region has contributed to the absence of regional co-operation in addressing urban air quality. The country has areas of high population densities and in turn, higher emissions and an approach of developing strategies for control of air pollution with identification of ‘regional airshed approach’(e.g., Indo-Gangetic Plane) in the country shall be adopted.
There is a clear need for a well coordinated, sponsored initiative to address the fundamental problem of urban air pollution and provide the basis for future regional co-operation leveraging on existing technical expertise, finances and seeking requisite International cooperation.
Cost-effective solutions need also to be developed through advanced research and analysis and integrated into the policy framework in various sectors like transport, health and even the industrial policy.
As pollution and urban meteorology are interlinked, a framework for mitigation of urbanization-altered temperatures will go hand in hand with mitigation of pollution as well.
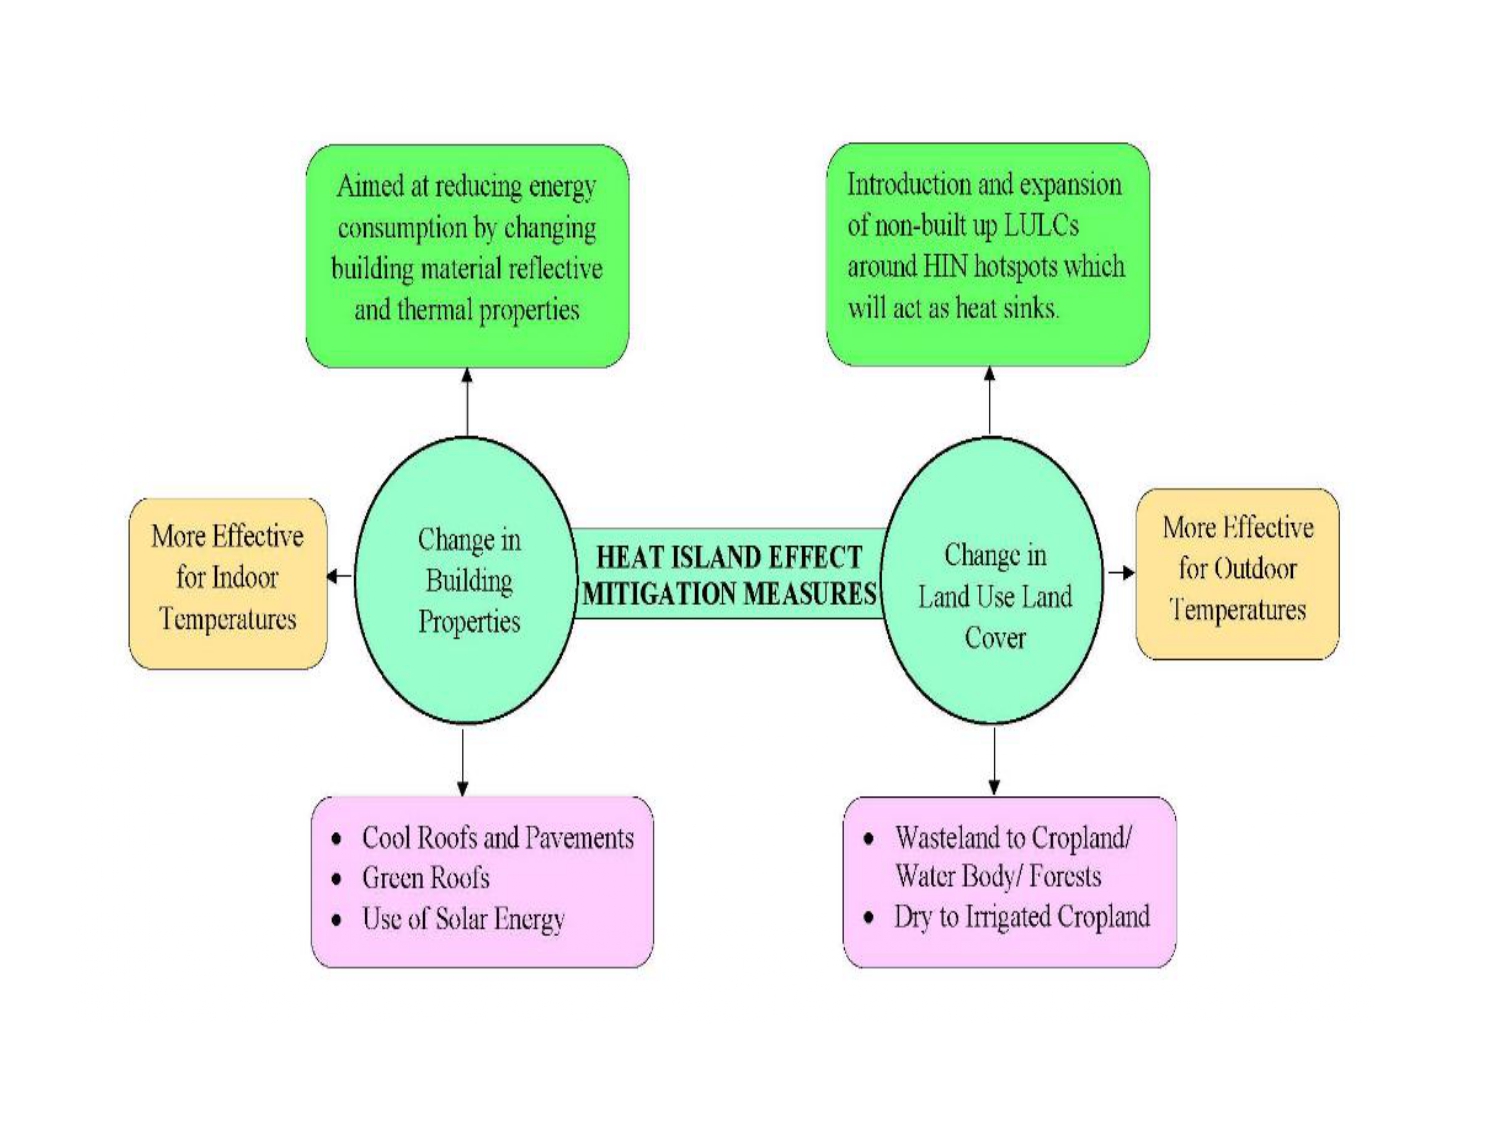
Figure 6: Heat Island mitigation measures reduce energy demand which in turn helps in mitigating air pollution (Source: HISAT Policy Report, 2018)
Research needed to address key issues
- A comprehensive understanding of both conventional and unaccounted sources and their emission characteristics is currently lacking. Representative emission inventories detailing the contribution from city- or industry-specific sources are needed. A holistic overview of emissions would also allow the efficient targeting of key individual sources, which if controlled, would lead to maximised benefits (Kumar et al, 2015).
- An extensive understanding of local versus peripheral, and peripheral versus regional, sources of emissions and their contribution towards local pollutant concentrations is essential. Development of a modelling framework to assess these aspects is required for air quality forecasting as well as analysis. Numerical modelling can aid in understanding the interplay of possible sources and could assist in evaluating the effect of any policy, infrastructure or technological interventions on cluster-wise emissions and ambient air pollution concentrations.
- Mostly we are dependent on health studies of western countries for assessing health impacts of pollutants. However, there are a lot of uncertainties with these kinds of dose-response relationships which depend on the population sample. Hence work needs to be done in our country to strengthen cohort studies to find the impacts on the local population.
- Research also needs to be focussed on the incorporation of satellite data to enhance in-situ monitoring network as well as supplement data inputs for modelling.
- Development of a single platform to share research and policy recommendations from different agencies involved in developing air pollution technologies and tackling strategies. Government agencies such as CPCB, CSIR, NEERI, SPCBs, MoES institutions and academic institutions such as IITs, IISER Mohali, involved either at policy or research level for air pollution management.
- The Centre for Atmospheric Sciences at Indian Institute of Technology Delhi establishment in 1979, is a centre of excellence promoting interdisciplinary research in air pollution, climate variability, urban climate, air-sea interaction, numerical modelling of atmosphere and ocean and monsoon studies to understand various physical and social consequences. In addition, IIT Delhi now has a Centre of Excellance for Research in Clean Air.
- Private organisations and NGOs such as CSE, Greenpeace also undertake various initiatives for research, survey and information dissemination. A common platform to share the work of all these agencies will facilitate coordination required for formulating air pollution management programs. India Science Technology and Innovation portal (ISTI) is a step in this direction.
Recommendations
- Chemical transport models (CTMs) shall be used as an appropriate tool for policy guidance.
- A data portal shall be made available in open access format with past and current data of all the sources across the country with strict implementation of Quality audit and quality control (QA/QC).
- The data available with the monitoring stations of industries and other academic organisations shall be made a part of this national data portal after facilitating similar QA/QC in order to enhance this national network.
- A standard QA/QC program needs to be evolved for PM10 and PM2.5 for newer sensor-based techniques.
- Exposure assessment shall be integral to policy making for recommending control strategies. Studies based on the local Indian population are required.
- City and industrial planning shall involve urban and environmental planners. Smart cities have been planned in India and sustainable development strategies shall require including mitigation strategies.
- In conclusion, it is important to look beyond monitoring, emission inventories, or source apportionment. Even the best science and technology will not succeed in reducing emissions and improving air quality if it is not considered in a broader framework of economic development of the country, raising awareness of public health risks, and technological progress which is compatible with the nation's cultural, geographical and social context.
- “Polluter Pays” has long been a policy of air pollution control worldwide. Thus, the major responsibility of the implementation of newer technologies for pollution reduction often comes up as high investment packages for concerned industrial units. The sole responsibility of implementing switching over from older technologies to newer ones for pollution reduction by the concerned industrial units are found to be less viable and delay implementation of easily practicable pollution reduction strategies under the regulatory framework. Technical and financial support with a viable model of sharing the burden of costs including public and private funding shall be worked out with strict timelines for ease of implementing the latest technologies in the wider interest of the general public.
- Unregulated emission sources such as waste and biomass burning, landfill sites, construction dust, dust from unpaved areas form a major contribution to deteriorating air quality and hence shall be given very high priority for abatement where the technologies are available involving wider participation both from industries and public.
References
- AirVisual. (2019). World most polluted cities in 2018 - pm2. 5 ranking | airvisual. (n.d.). Retrieved June 2, 2019, from https://www.airvisual.com/world-most-polluted-cities
- Bernard, S. &Kazmin, A. Dirty air: how India became the most polluted country on earth. (n.d.). Financial Times, December 11, 2018. Retrieved May 26, 2019, from https://ig.ft.com/india-pollution
- Cohen, A. J., Brauer, M., Burnett, R., Anderson, H. R., Frostad, J., Estep, K., … Forouzanfar, M. H. (2017). Estimates and 25-year trends of the global burden of disease attributable to ambient air pollution: an analysis of data from the Global Burden of Diseases Study 2015. The Lancet, 389(10082), 1907–1918. https://doi.org/10.1016/S0140-6736(17)30505-6
- CPCB (2006) Central Pollution Control Board. Air Quality Trends and Action Plan for Control of Air Pollution from Seventeen Cities. National Ambient Air Quality Monitoring Series: NAAQMS/29/2006-07
- CPCB (2018) National Air Quality Index December-2018
- CPCB (2019) Continuous Ambient Air Quality Monitoring. https://app.cpcbccr.com/ccr/#/caaqm-dashboard-all/caaqm-landing
- EPA (2015, December 10). Managing air quality - air pollutant types [Overviews and Factsheets]. Retrieved June 1, 2019, from US EPA website: https://www.epa.gov/air-quality-management-process/managing-air-quality-air-pollutant-types
- EPIC (2018). Indians could live up to three years more if there’s a 25% reduction in air pollution | Energy Policy Institute at University of Chicago. (n.d.). Retrieved May 25, 2019, from https://epic.uchicago.edu/news-events/news/indians-could-live-three-year...
- European commission, Joint Research Centre, Measuring air pollution with low-cost sensors http://ec.europa.eu/environment/air/pdf/Brochure%20lower-cost%20sensors.pdf
- Gunwani, P., & Mohan, M. (2017). Sensitivity of WRF model estimates to various PBL parameterizations in different climatic zones over India. Atmospheric Research, 194, 43–65. https://doi.org/10.1016/j.atmosres.2017.04.026
- Gupta, M., & Mohan, M. (2013). Assessment of contribution to PM10 concentrations from long range transport of pollutants using WRF/Chem over a subtropical urban airshed. Atmospheric Pollution Research, 4(4), 405-410. doi:https://doi.org/10.5094/APR.2013.046
- Gupta, M., & Mohan, M. (2015). Validation of WRF/Chem model and sensitivity of chemical mechanisms to ozone simulation over megacity Delhi. Atmospheric Environment, 122, 220–229. https://doi.org/10.1016/j.atmosenv.2015.09.039
- Gurjar, B. R., Ravindra, K., &Nagpure, A. S. (2016). Air pollution trends over Indian megacities and their local-to-global implications. Atmospheric Environment, 142, 475–495. https://doi.org/10.1016/j.atmosenv.2016.06.030
- Guttikunda, S. (2018, May 11). Daily dose of air pollution: breaking down WHO 2018 AAP database for Indian cities. Retrieved May 26, 2019, from Daily Dose of Air Pollution website: http://urbanemissions.blogspot.com/2018/05/breaking-down-who-2018-aap-da...
- Guttikunda, S. K., & Goel, R. (2013). Health impacts of particulate pollution in a megacity—Delhi, India. Environmental Development, 6, 8–20. https://doi.org/10.1016/j.envdev.2012.12.002
- Guttikunda, S. K., Goel, R., & Pant, P. (2014). Nature of air pollution, emission sources, and management in the Indian cities. Atmospheric Environment, 95, 501-510. doi:10.1016/j.atmosenv.2014.07.006
- Koshy, J. (2019, March 5). Fifteen of the 20 most polluted cities in the world are in India. The Hindu. Retrieved from https://www.thehindu.com/sci-tech/energy-and-environment/fifteen-of-the-...
- Kumar, P., Khare, M., Harrison, R.M., Bloss, W.J., Lewis, A.C., Coe, H., &Morawska, L. (2015). New directions: Air pollution challenges for developing megacities like Delhi.
- Mohan, M., & Bhati, S. (2011). Analysis of wrf model performance over subtropical region of delhi, india. Advances in Meteorology, 2011, 1–13. https://doi.org/10.1155/2011/621235
- Mohan, M., & Gupta, M. (2018). Sensitivity of PBL parameterizations on PM10 and ozone simulation using chemical transport model WRF-Chem over a sub-tropical urban airshed in India. Atmospheric Environment, 185, 53–63. https://doi.org/10.1016/j.atmosenv.2018.04.054
- Mohan, M., & Sati, A. P. (2016). WRF model performance analysis for a suite of simulation design. Atmospheric Research, 169, 280–291. https://doi.org/10.1016/j.atmosres.2015.10.013
- Mohan, M., Kikegawa, Y., Gurjar, B. R., Bhati, S., Kandya, A., & Ogawa, K. (2012). Urban heat island assessment for a tropical urban airshed in india. 2012. https://doi.org/10.4236/acs.2012.22014
- Mohan, M. (2018). HISAT Policy Report. Odisha State Pollution Control Board
- Prasad, R.V., Baig, M.S., Mishra, R.K., Rajalakshmi, P., Desai, U.B., & Merchant, S. (2011). Real time wireless air pollution monitoring system. ICTACT Journal on Communication Technology, 02(02), 370–375. https://doi.org/10.21917/ijct.2011.0051
- Sati, A. P., & Mohan, M. (2018). The impact of urbanization during half a century on surface meteorology based on WRF model simulations over National Capital Region, India. Theoretical and Applied Climatology, 134(1), 309–323. https://doi.org/10.1007/s00704-017-2275-6
- WHO (2016) Healthy Environment; Healthy People.
- http://www.searo.who.int/india/topics/air_pollution/unewsnewsletter_june2016_healthandenvironment.pdf
- WHO (2018) Addressing the challenge of air pollution in India. Retrieved May 26, 2019, from http://www.searo.who.int/india/topics/air_pollution/air_pollution_media_note.pdf
Prof. Manju Mohan
Professor and Head,
Centre for Atmospheric Sciences,
India Institute of Technology,
Hauz Khas, New Delhi-110016
Disclaimer: This work has been submitted by the author. Any opinions, findings, conclusions or recommendations expressed in this article are those of the author only and do not necessarily reflect the views of organization.